 Russian
 English
 German
 French
 Portuguese
 Spainish
 Italian
 Chinese
Upgrading of a lead-fluorspar ore by flotation: effects of ore characteristics and kinetics of flotation
Escobar, A.G. 1 , Seltmann, R. 2* , Broadbent, C. 3 , Robinson, P. 4
-
Universidade de Lisboa – Faculdade de Ciências, Portugal
-
Dept. Earth Sciences, NHM London, UK
-
Wardell Armstrong International (WAI), UK
-
British Fluorspar Limited (BFL), UK
* Corresponding author: r.seltmann@nhm.ac.uk
ABSTRACT:
British Fluorspar Ltd (BFL) operates a lead-fluorite-barite deposit located in the Peak Lake District (Derbyshire, UK) with fluorspar as the main product and lead and barite as by-products. Recent analysis of the CaF2 concentrate showed high values of deleterious elements such as Pb, P, S and As, which affect the quality of the product. Grindability studies showed an overgrinding of material prior to the flotation stage with high liberation of P2O5 mainly to the fluorspar concentrate.
Data obtained from bath flotation test indicated an improvement of lead recovery from 2.33% to 15.03%, decreasing Na2S to 100g/T and pH to 9 in the lead oxide circuit and a depression of P2O5 in the fluorspar flotation stage from 87% to 91% recovered in the tailings using 200 g/T of CaCl-CuSO4 as “depressant” of phosphates related minerals.
Key Words :fluorspar flotation; lead-fluorite; barite; phosphorus.
INTRODUCTION
Recently, Europe has become increasingly reliant on the import of non-energy solid raw materials although historically Europe has been in front of many innovative projects in mining and mineral processing especially those ones focusing on improvement of competitiveness in the raw materials’ sector.
The EU has created a list of raw materials (CRMs) critical to Europe’s economy. The CRM’s are materials of high importance with a high risk associated with their supply.1, Fluorspar was included in the list of critical raw materials (CRM) in 2010-2011 due to the risks of supply shortage and their impacts on the economy are higher compared with most of the other raw materials. A high share of the worldwide production mainly comes from a handful of countries; in the fluorspar case China and Mexico2. Fluorspar remains on the EU CRM list issued in September 20173 Asia Pacific accounted for over 60% of the market share in 2014 and is projected to be the fastest growing market in coming years, due to rising demand for fluorspar in steel and aluminium industries. Furthermore, demand of hydrofluoric acid and its derivatives for usage in electronic appliances such as refrigerator, air-conditioners, and other cooling equipment is estimated to boost the consumption of fluorspar in Asia Pacific. Demand for fluorspar in North America and Europe is expected to be sluggish owing to slower growth rate in steel production and aluminium production industries. Each one these industries requiring an ever-higher quality of the final product.
Growing demands on high quality of fluorspar products specifically with lower contents of contaminant elements contaminants creates a need for a better mineralogical and metallurgical understanding of the ore (s).
The processing of fluorite ores especially those that contain calcite minerals is challenging due to the fact that flotation properties of fluorite, calcite, and other gangue minerals are similar. (Filippova, et al., 2014)
Typically, in the commercial operations, fatty acid collectors (Fuerstenau et al., 2006) are used in fluorspar flotation and water glass as a depressant (Zhou et al., 2013) of silicate gangues; the ore pulps are heated to 35–85 C in the system (Crozier, 1992). Normally fatty acids are saponified in alkaline medium (i.e. NaOH). Most recently fatty acids are emulsified with the use of a surfactant plus fuel oil. (Baldwin & Wittcoff, 1955)
The type of fatty acid plays an important role in both selectivity and recovery of fluorspar. The activation of fluorspar is (Zhang & Song, 2003) affected by the reaction of an unsaturated fatty acid with the calcium atom of calcium fluoride to form an insoluble film of calcium oleate on the surface of the fluorspar particles. (Rao & Forssberg, 1991)
Unsaturated fatty acids high in oleic and linoleic acids of both vegetable and animal tallow origin are used. The fatty acids of vegetable origin have a typical oleic acid content of about 55%, linoleic 40% and resin acids 1-5%. Fatty acids of tallow origin have an oleic content of 70-80% with 5-8% linoleic and other unsaturated acids. Fatty acids high in oleic acid tend to be a little weak, and those of a resin content of more than 4% tend to make a strong froth of low selectivity. Worldwide, there is a tendency to adapt the flotation process to the fatty acid most readily available. Fluorspar flotation requires the crowding out of gangue minerals from the froth, with a minimum use of frothers. MIBC or similar alcohol frothers are sometimes used to liven up a heavy dead froth to facilitate its removal from the flotation cells. Collectors containing 1-3% of resin acids generally produce optimum froth conditions and no supplemental frothers are necessary (Weiss, 1985; Bulatovic, 2015))
The pH is varied over a wide range in fluorspar flotation from 8.5 – 10, with most mills operating in the range of 9.0 – 9.3. A stronger float results at a high pH, but with a coarse grind can still be selective. Once the reagent combination is established it is necessary to hold to a closely controlled pH. Soda ash is used for pH control, although sodium silicate when used also contributes to alkalinity. (Weiss, 1985)
Caustic soda has been used on siliceous ores and as a supplement to soda ash.
Temperature is an important tool in fluorspar flotation. Temperatures in the range of 25 - 90°C are used. Below a temperature of 24°C the fluorspar float is slow and less selective than a higher temperature (Gao et al, 2021). Live steam is injected into the mineral slurry in the conditions and at various points in the flotation circuits. Temperatures above 82°C are used in the boiling process. In this process, live steam is injected into the conditioner, with fatty acid, which results in a strong, selective activation of fluorspar. A heavy, matted froth is produced from which gangue minerals are selectively rejected.
Fluorspar flotation feed receives preliminary treatment in conditioners where reagents are added for pH regulation and gangue depression and dispersion. Live steam is injected for maintaining optimum temperature. Two conditioners in series are sometimes used ahead of the rougher float. Reagents for pH control and dispersion are added to the first conditioner and gangue depressing reagents are added to the second. The flotation feed is then ready for the addition of fatty acid collector at the flotation cells. Conditioning time is generally in the range of 8-15 minutes. (Weiss, 1985)
2 MATERIALS AND EXPERIMENTAL PROCEDURE
2.1 Ore samples
Samples from mineral processing streams from Cavendish Mill (BFL) processing plant in the UK were used during this investigation. 10kg from the Pb flotation feed stream and 15kg from the CaF2 flotation feed were taken in a period of 3hr, the shortest time possible was used to reduce the variability in the plant feed These samples were similar in physical and mineralogical aspects.
The plant feed consists of material from mineral deposits in the South Pennine Orefield (SPO). These have been deposited in dilatant fractures, dissolution cavities and zones of metasomatic replacement. The host rock consists almost exclusively of shallow water carbonates of Asbian-Brigantian (late Dinantian) age (Ford, 2000). The primary mineralization comprises only fluorite, barite, calcite, galena, and sphalerite. Iron sulphides such as pyrite, chalcopyrite and bravoite, are found in microscopic amounts within the main minerals. Nearly all other mineral types described from the SPO are secondary in origin, having resulted from oxidation of the primary minerals. (Quirk, 1993)
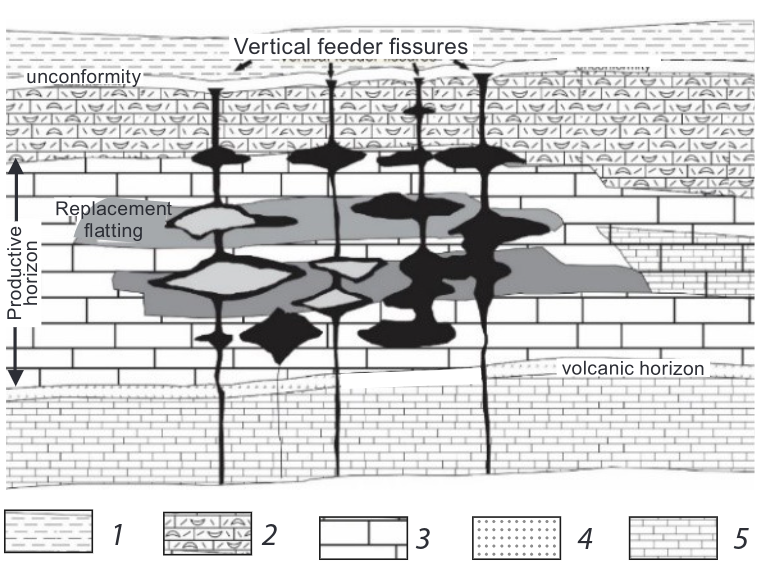
Figure 1 Fissure vein fill structures and replacement scheme for BFL Mine, UK.
2.2 Current plant conditions
Bulk concentrate recoveries in the plant for lead and fluorite varies from 85 to 90%. The lead recovery is 90% and around 6% is lost in the CaF2 concentrate and 4% in the BaSO4 concentrate. The Pb content in the CaF2 concentrate represents a contaminant. The CaF2 recovery varies between 80 to 85%.
The particle size distribution for the flotation feed is shown in the Figure 2. There is a slight difference between the PbS feed flotation curve and the floated product curves, this difference could be related with kinetics of flotation and the liberation degree of targeted minerals. The sulphides which should float in the first flotation stage due to its properties are more brittle than gangue minerals and it is believed to be finer than the gangue minerals which considering that optimum flotation can be related with mineral density, fine particles of galena should float very well. However, as it is possible to observe in the PSD curve, tailings of PbO flotation (CaF2 feed) conserve the same distribution and the initial flotation feed and the fine particles are floating better in the fluorite flotation stage. It could mean that fine particles of galena are interlocked with fluorite as suggested in the MLA study done previously (29% of lead floated in the fluorspar concentrated was < 10 µm).
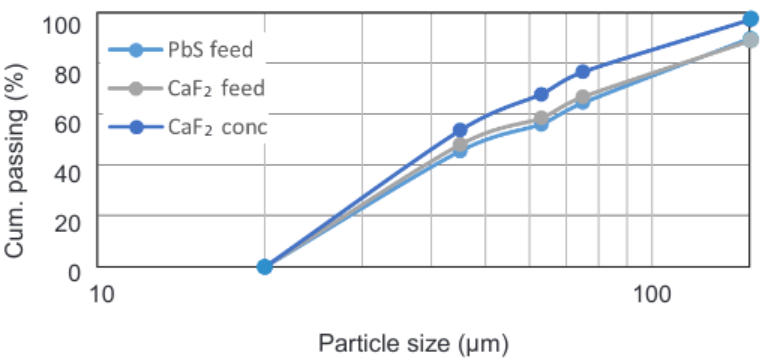
Figure 2. Particle size distribution curves for PbS feed, CaF2 feed and CaF2 concentrate.
It was not possible to sample the tailing stream so the effect of particle size in flotation could not be evaluated.
2.3 Chemical reagents
Sodium Isopropyl Xanthate (SIPX), sodium sulphide (Na2S), MIBC, sodium carbonate, causticized dextrin, sodium metasilicate, tan-X, oleic acid and sodium carbonate were all high-grade chemical reagents.
2.4 Experimental procedures
A 2000 ml Denver sub-aeration flotation cell was used for carrying out the flotation tests of samples. A pulp with 30% solids of samples were added to the cell. The pH of the pulp was adjusted for 3 minutes at pH value of 10.5 for most of the test and varied according to the parameters needed and at temperature value of 20oC during conditioning and flotation by continuously adding the lead and fluorspar reagents. After 3 minutes of mixing the required amount of collector (SIPX) and frother (MIBC) was added, and conditioning continued for three more minutes in absence of air flow. Air was then introduced into the cell and flotation continued until barren froth was observed (2– 3 min). The flotation products were collected, filtered, washed, dried, weighed and analysed by XRF.
3 RESULTS AND DISCUSSION
3.1 Lead sulphide and lead oxide flotation
When parameters as the mass flow and the material in feed are fixed, the relation between them can be estimated from the grade vs. recovery curves. The performance of the flotation process will move along these curves when the different parameters vary in the tests.
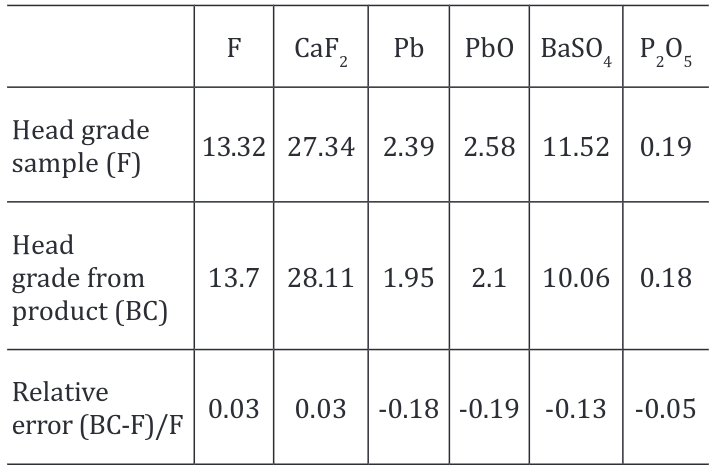
Test FT1 is a downscale of the current process in flowsheet used at Cavendish Mill and is the starting point for the comparison of the tests. Chemical analysis results from products were used to compare the head grade from the sample with the back calculated grade (Figure 3). Relative error was calculated (Table 1) as an indicator of how good back calculated results are relative to the head grade of the sample. Back calculated results and head grade of sample do not present a big difference between them, and its similarity indicates that there was no significant experimental error during the flotation procedure.
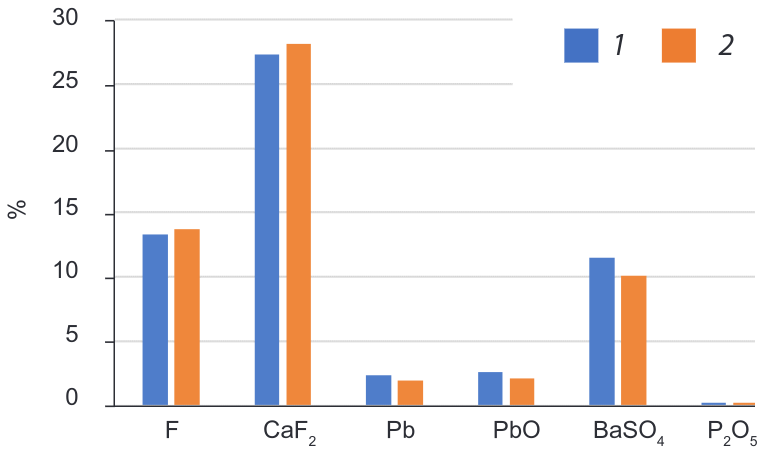
Figure 3. Head grade sample vs Head grade from products BC= back calculated in lead flotation
Table 1. Head grade sample vs head grade from products – back calculated in lead flotation.
3.1.1 Effect of different reagent’s dosage
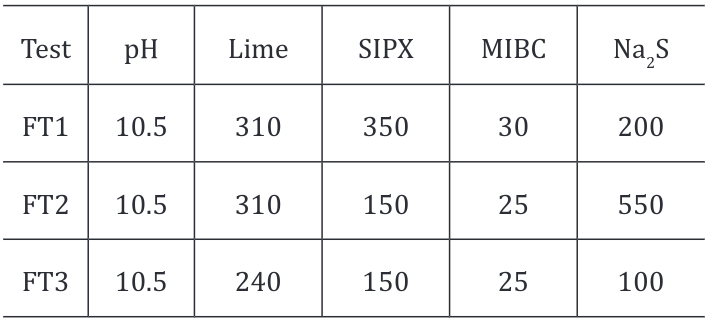
Tests FT1 to FT3 (Table 2) on PbS flotation sample, showed that the current conditions of the plant are the more suitable dosage for the PbS/PbO flotation in terms of high grade and high recovery.
Table 2. Reagent’s dosage for different flotation test.
However, as the process simulated two different flotation stages for lead sulphide and lead oxide the selectivity of rougher flotation for lead was examined on grade-recovery curves with cumulative values of 2 to 10 minutes. Following the concept of selective concentration, test FT3 represents more selectivity for lead recovery in the process as shown in the Figure 4 . At industrial scale in Cavendish mill, it is important to achieve higher and selective recovery than higher grades. The curve for FT1 seems to be constant but non-selective for sulphides.
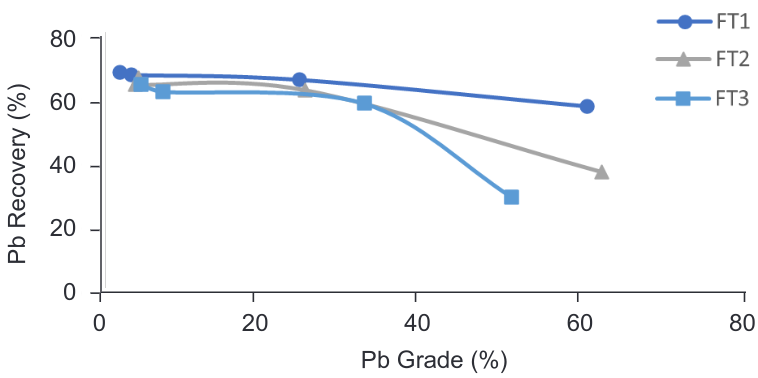
Figure 4. Grade vs Recovery curve – PbS/PbO flotation different reagent’s dosage
3.1.2 Effect of the pH
It is known that galena (main sulphide mineral in the ore) can float at pH 6.5 and higher. Altering pH from that used currently in the plant was tested to achieve a high recovery of lead and lower contaminants in the concentrate. The flotation tests (FT3, FT4 and FT6) were designed in a way that if successful it did not affect subsequent flotation stages.
Tests FT3, FT4 and FT6 were performed at pH 10.5 (slightly above galena critical pH), 9 and 8 respectively and with the same reagent’s dosage as the FT1 (current conditions of the plant).
The negative effect on the lead sulphide flotation at pH 8 is observed, where the recovery is significantly lower and the lower grade of Pb decrease from the lead sulphide to the lead oxide flotation concentrate. There is a slight difference in recovery between pH 10.5 and 9 with 63.76% and 63.20% respectively. In terms of grade, as shown in the Figure 5 it is possible to achieve a higher grade of Pb at pH 9 positioning this parameter as the most suitable for the flotation of lead sulphides and lead oxides present in the Milldam ore.
However, maintaining a pulp at a particular pH value does not necessarily provide information regarding the chemistry changes occurring within the plant.
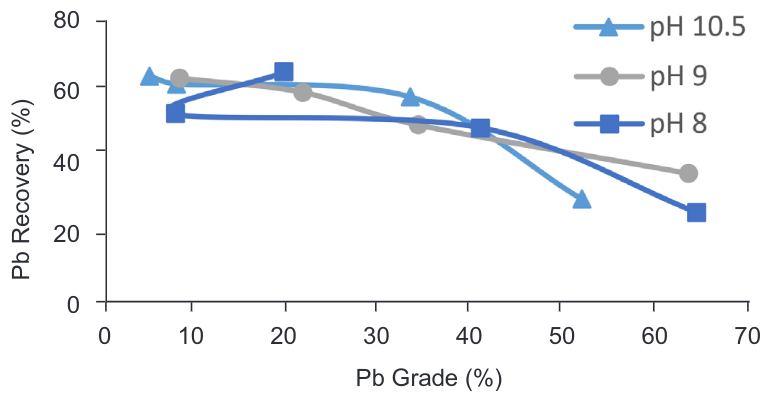
Figure 5. Grade vs Recovery curve – PbS/PbO flotation at different pH
3.1.3 Effect of different pH regulator
Currently, Cavendish Mill uses soda ash as the pH regulator due to its effectiveness in fluorite flotation, however, the lead flotation tests were performed with lime as the most common pH regulator in sulphide flotation. In order to estimate if there are any effect in the flotation process changing the pH regulators test FT4 and FT7 were performed.
Even when the grade-recovery curves (Figure 6) present a similar trend, it was found that soda ash affects the Pb oxide flotation with a decrease in both lead grade and recovery.
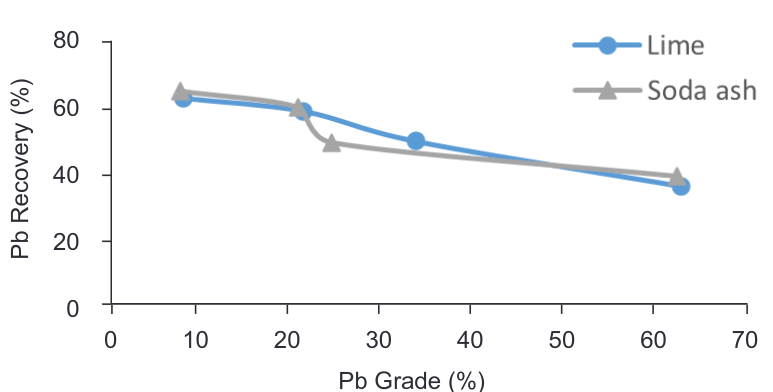
Figure 6. Grade vs Recovery curve – PbS/PbO flotation with different pH regulators
3.1.4 Effect of Eh control in PbO flotation
The measurement and control of other pulp physical chemistry parameters (Eh, dissolved oxygen and temperature) in base metal flotation plants is somewhat limited.
Greet et al., (2006) suggested that it has been recognized for some time that Eh may impart considerable information about sulphide mineral system under investigation. Authors have dedicated their work to prove the relationship between sulphide minerals surfaces and electrochemical nature (Woods, 1976). Several works demonstrated the possibility of using Eh as a tool to identify mineral oxidation and adsorption of collectors (Winter and Woods, 1973; Woods et al, 1990; Woods et al, 1992). Nevertheless, it is important to mention than Eh readings are better to use in laboratory scale but not in flotation plants, considering than those readings obtained correspond to a mixed potential (Woods, 1976).
It was possible to observe during lab scale that adding sodium silicate to the pulp keep values of Eh stable. The Eh was then monitored adding sodium silicate until a value of -50 was stabilized in the pulp during conditioning time of PbO flotation. However, it is possible to observe that when Eh was controlled the grades and recoveries of lead decreased (Figure 7).
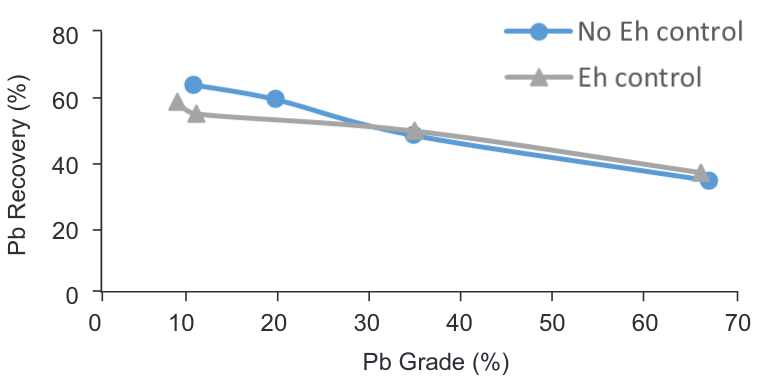
Figure 7. Grade vs Recovery curve – PbS/PbO flotation controlling Eh/mV
3.1.5 Effect of combination of reagents
As mentioned previously, the reagents for the lead sulphide flotation are added in the ball mill which means that the sample used for FT5, FT9 and FT10, collected in the flotation feed tank already contains SIPX and MIBC so, Aerophine 3418A promoter was used to increase the selectivity of galena in the presence of arsenic, iron and some non-activated zinc minerals.
Aerophine 3418A promoter is an effective primary collector in the selective flotation of lead, gold silver minerals and complex lead minerals with high silver content or lead minerals where the head grade of lead does not exceed 1.50 percent (product data sheet CYTEC).
Even when the results (Figure 8) show a similar behaviour during the sulphide flotation, it is possible to observe the big changes produced in the oxide flotation increasing mainly the lead recovery. For a lower concentration of promoter both recovery and grade increased significantly compared with test undertaken with no promoter added, making these parameters more efficient than current ones used in the plant.
The results indicate that even when the recoveries are higher when promoter 3418A is used the final grade of the concentrate obtained is better when SIPX used.
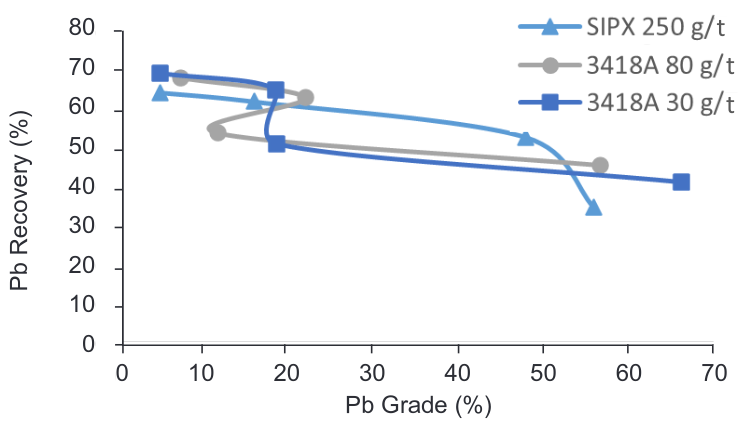
Figure 8. Grade vs Recovery curve – PbS/PbO flotation using different sulphide collector.
3.2 Fluorspar flotation
For the CaF2 flotation stage as in the previous analysis, different parameters were combined in order to find the more suitable conditions for depressing P2O5 without affecting CaF2 grade and recovery.
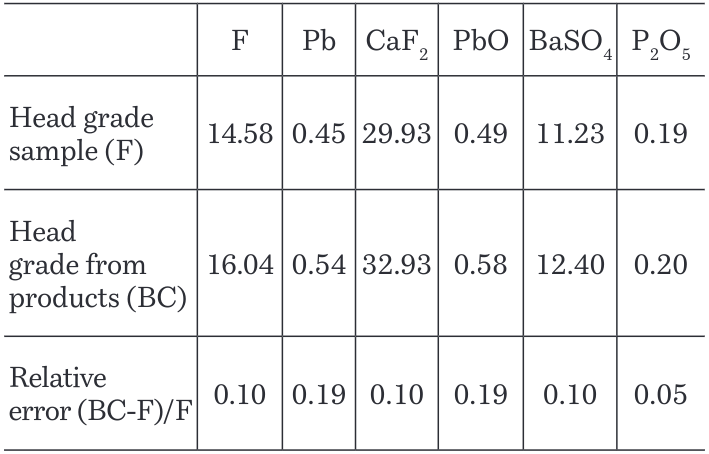
Chemical analysis results from products were used to compare the head grade from the sample with the back calculated grade (BC). Relative error was calculated as an indicator of how good back calculated results are relative to the head grade of the sample (Table 3). Back calculated results and head grade of sample do not present a big difference between them, and its similarity could be related with the same analytical method used in both cases as lead flotation.
Table 3. Head grade sample vs head grade from products – back calculated in fluorspar flotation.
3.2.1 Effect of the temperature
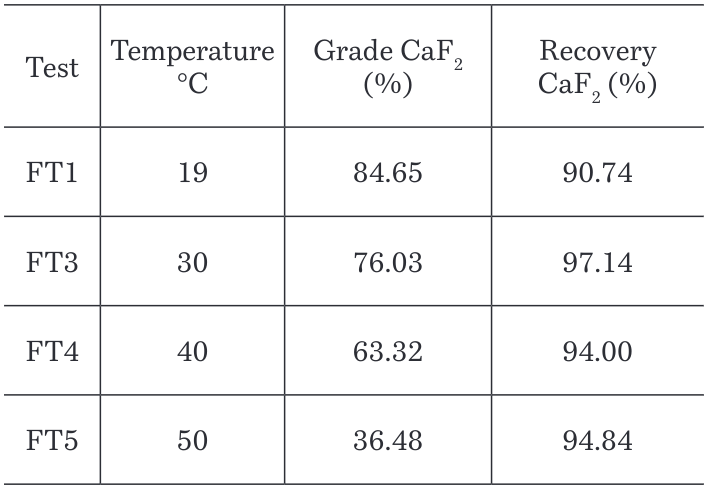
Solubility of oleic acid in higher temperature and basic pH is increased therefore its performance as collector for floatation is more selective and better; current conditions in the plant perform flotation in temperatures around 9 – 18°C. Considering the valuable effect that temperature can produce in fluorite flotation test FT1, FT3, FT4 and FT5 at 19, 30, 40 and 50°C respectively were performed.
Increasing the solubility in the reagents and their selectivity should increase recovery in the flotation cell. As shown in Table 4 the optimum and highest recovery for the CaF2 flotation is achieved at a temperature = 30°C. Further test at temperatures higher than 50°C should be studied considering that recoveries started to increase again at this point of the graphic.
Table 4. Grades and recoveries results at different temperatures in CaF2 flotation
On the other hand, the aim of our study comprises the behaviour and the recovery of the P2O5 in the tails and the decreasing of grade in the concentrate compare with the current conditions of the plant. The graphic in the Figure 9 shows the effect of temperature in the depression of P2O5 during flotation translated into the grade and recovery in the flotation tailings.
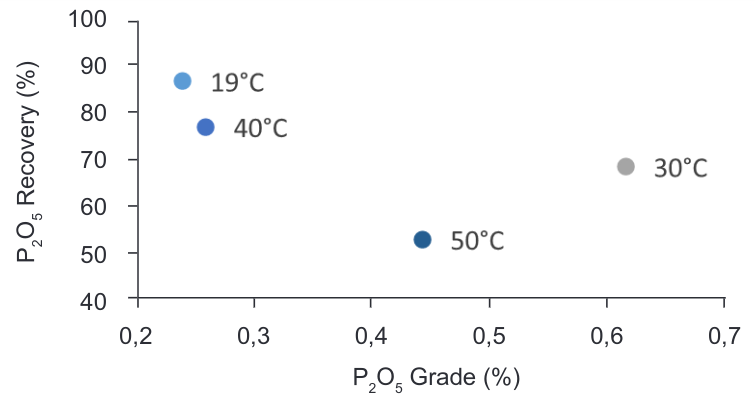
Figure 9. Grade vs Recovery curve – CaF2-P2O5 flotation at different temperature
3.2.2 Effect of pH
As mentioned before the current conditions in the plant are adjusted to work at pH 10.5. Considering that the main gangue of the material is calcite, quartz and phosphates FT1 and FT2 were performed to analyse the effect in the depression of P2O5.
Song et al. (2006) mentioned in their study about improving fluorite flotation that according to the DLVO theory (Verwey and Overbeek, 1947), aggregative stability of colloidal suspensions is due to the existence of a potential energy barrier between particles preventing the proximity of the particles, and the potential energy barrier arises as a result of interaction energies of electrical double layer and van der Waals. For the systems of fluorite–quartz and calcite–quartz in aqueous solutions, the van der Waals interaction between the particles is always attractive and the electrical double layer interaction is also attractive at pH 9.0 because the interacted particles are charged reversely. Therefore, at pH 9.0, the total potential energy of interaction between fluorite and quartz particles or calcite and quartz particles is attractive at every distance.
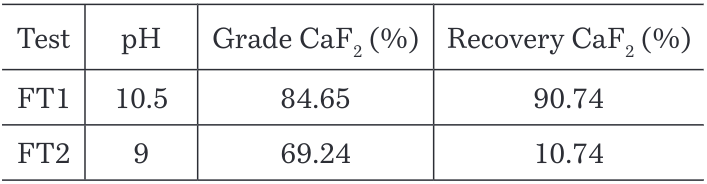
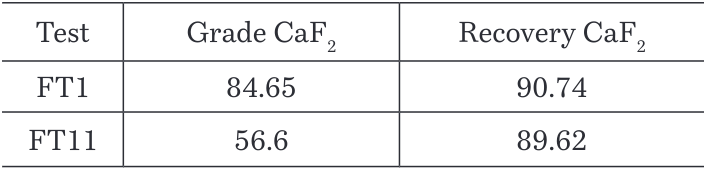
It was found that the recovery of P2O5 in the tailings increases at lower pH as shown in the Figure 10, but when performing the test, it was observed that the froth was not stable at pH 9 and most of the material stayed in the cell. The Table 5 supports these observations as just a 10.74% CaF2 recovery was achieved in the test at pH 9 against 90.74% recovery at pH 10.5 where the froth was strong and stable.
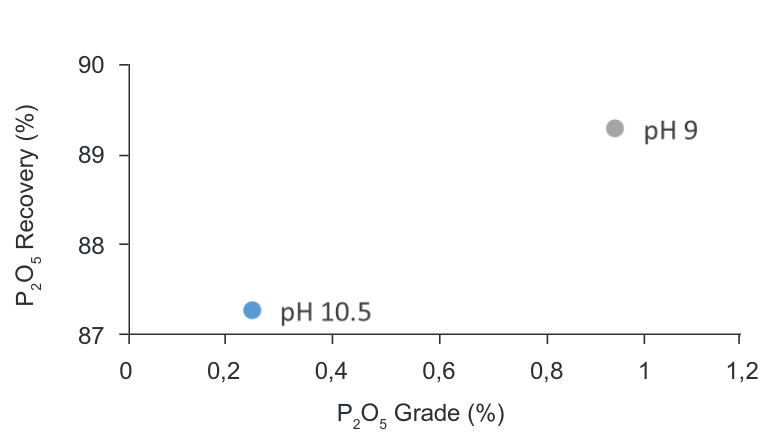
Figure 10. Grade vs Recovery curve – CaF2-P2O5 flotation at different pH
Table 5. Grades and recoveries for CaF2 at different pH
It is important to mention that both tests were performed at natural temperature as the current plant conditions at around 18°C. In order to observe the effect of the combined parameters pH and temperature and additional flotation test was performed at pH 9 and 40°C temperature, finding an increasing in recovery for P2O5 in the tailings with a value of 88.13% and a recovery of CaF2 of 82.99% which is not convenient for the objectives of this study.
3.2.3 Effect of CuSO4 for removal of phosphates
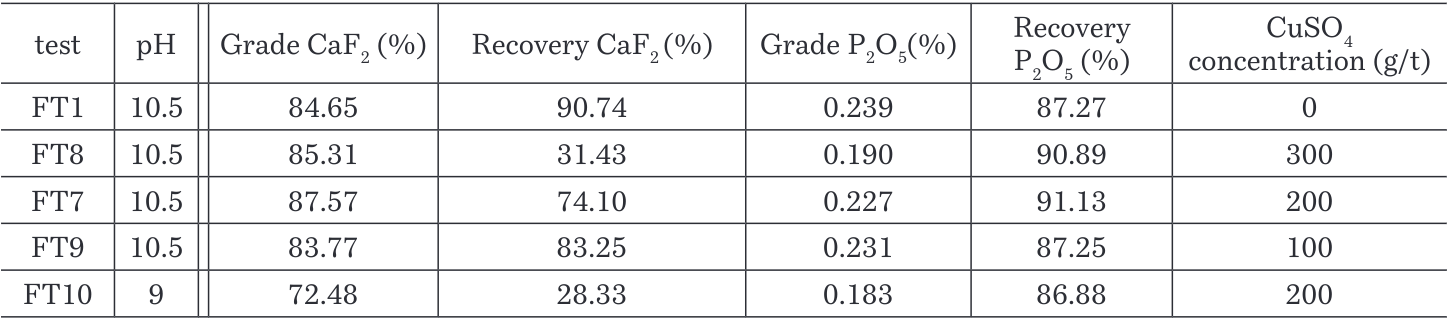
Test FT7, FT8, FT9 and FT10 were performed using a copper sulphate as possible removal of P2O5 in the rougher flotation without affecting the flotation of CaF2 (Zhang and Zong, 2003).
According to the results, as shown in the Figure 11 a significant reduction of the content of P2O5 in the concentrate translated in a high recovery of P2O5 in the tailings was achieved using 200g/t of CuSO4 at pH 10.5. P2O5 recovery increases by 4% compared to current conditions in the plant. Table 6 shows the recovery of CaF2 decreases but the grade resulted with a slightly higher difference with the current conditions.
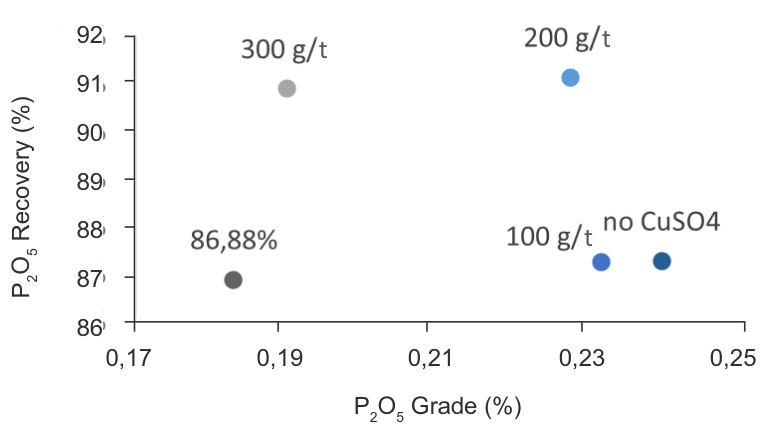
Figure 11. Grade vs Recovery curve – CaF2-P2O5 flotation with CuSO4 as depressant
Table 6. Grades and recoveries of CaF2 and P2O5 with different dosages of CuSO4
3.2.4 Effect of CMC as depressant
Song et al. (2006) found that the dispersion processing with CMC as dispersant could effectively improve the fluorite flotation, increasing the fluorite recovery from 72% to 78.5% at the same concentrate grade of 98% CaF2. The idea using CMC as depressant has an advantage of elimination of the heterocoagulation considering its flocculation effect between calcite and fluorite particles, in order to improve the beneficiation of the fluorite ore by froth flotation. As mentioned previously the used of different reagent as disperser and depressor was succesful for the authors (Li, 2015), but a different effect was found in the Milldam sample.
As shown in Table 7, both grade and recovery of CaF2 decreased with the use of CMC and the addition of CuSO4 keeps being more effective than other depressants. This negative effect in the process could be related with the high dosage of CMC during the flotation test and also to the mineral associations in the ore.
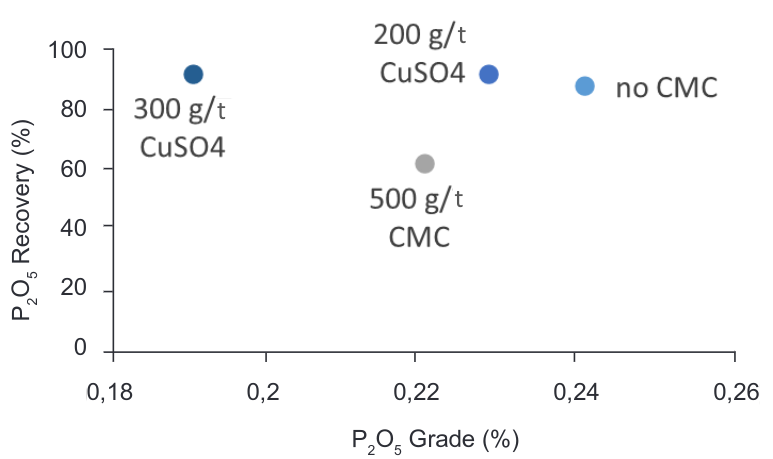
Figure 12. Grade vs Recovery curve – CaF2-P2O5 flotation with CMC as depressant
Table 7. Grade and recoveries of CaF2 with CMC as depressant
3.2.5 Combined effect of pH, reagent’s dosage and CuSO4 as depressant
It is probable that the flotation kinetics is improved when different parameters are combined and not with a change in only one of them. In previous tests was possible to observe how grades and recoveries changes with pH, temperature, reagents and dosages. Tests FT7, FT10, FT12 and FT13 (Table 8) were performed in order to compare the best relation of parameters for the best P2O5 recovery achieved.
Table 8. pH, reagents dosage and depressants in CaF2/P2O5 flotation tests
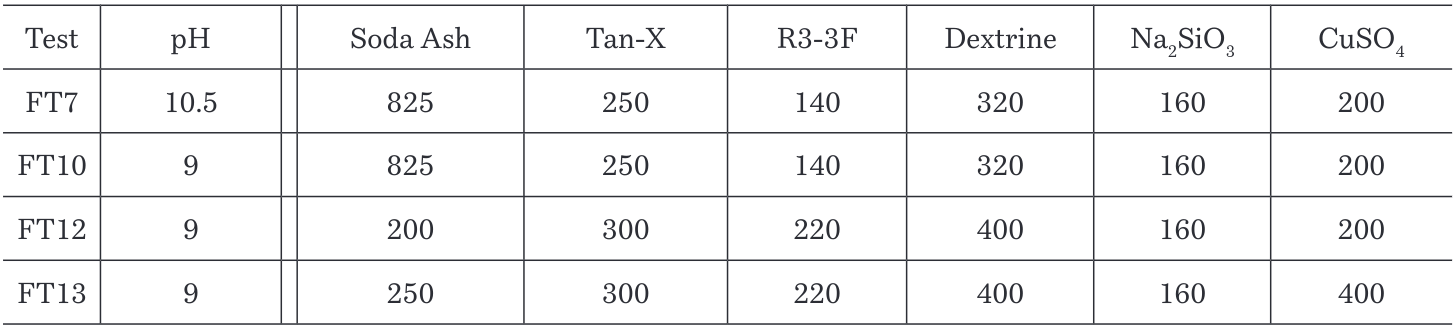
Figure 13 shows that the best recovery for P2O5 is given at pH 10.5, with the current concentration of Tan-X used in the plant (250 g/T) and adding to the process 200g/T of CuSO4 (depressant) with a recovery value of 91.15%, which represents an increase of 3% on current dosage in the plant.
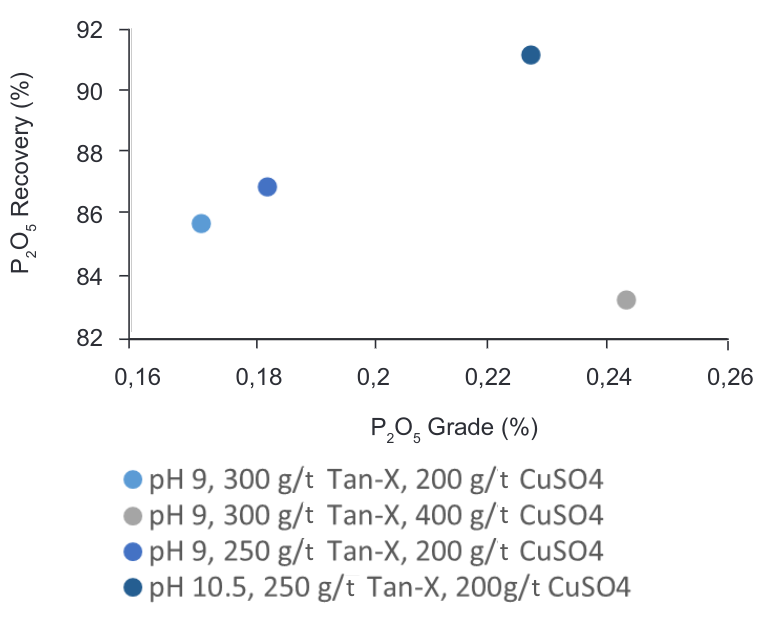
Figure 13. Grade vs Recovery curve – CaF2-P2O5 flotation at different pH and different reagent’s dosages
4 Discussion
The fully liberated lead in the fluorspar concentrate can be reduced improving the selectivity and recovery in the PbO flotation stage either (i) adding a promoter (3418A) in the PbS flotation cell by decreasing reagent’s dosage (to 100g/T) and pH (to 9) or (ii) decreasing reagent’s dosage (to 100g/T) and pH (9). Batch flotation test at current conditions in the plant recovered 2.33% Pb in the lead oxide flotation whereas at option (i) recovered 18.03% Pb and at option (ii) recovered 15.71% Pb. It was found that option (i) not only improves the recovery of lead in PbO flotation stage, also improves the recovery of sulphur sulphide in final concentrate which leads to a lower amount of sulphur going to the fluorspar flotation feed. As mentioned previously in this study the company aims to increase the lead recovery even if the process decreases the lead grade in the concentrate.
The content of calcite and Ca phosphates in the CaF2 concentrate can be reduced, by adjusting the reagents in the rougher-cleaner system with the current reagents’ dosage and including the use of salted-copper sulphate (NaCl-CuSO4) as “depressant” (effective removal) of gangue minerals specially those ones associated with phosphates (calcite and quartz). The maximum recovery of P2O5 (91.13%) in the tailings for fluorspar flotation was achieved with a dosage of 200g/t in a batch rougher flotation with the current conditions of the plant.
An optimum reduction of the P2O5 in the concentrate can be achieved either (iii) adding the CuSO4 as depressant in the rougher system and cleaner 1 to 3 or (iv) adding the CuSO4 as depressant in the cleaners.
The proportions to reduce the CuSO4 from rougher to cleaner or in the cleaner system.
5Conclusions
Obtained data from bath flotation test in the PbS/PbO system proposed an improvement of lead recovery from 2.33% to 15.03% by decreasing collector dosage (Na2S) to 100g/T and adjusting pH to 9 just in the lead oxide circuit or an improvement from 2.33 % to 18.01 % adding Aerophine 3418A as a promoter in the lead sulphide flotation.
Results from the fluorspar flotation stage focused on the reduction of P2O5 content in the concentrate proposed a depression of P2O5 in the fluorspar flotation stage from 87% to 91% recovered in the tailings using 200 g/t of NaCl-CuSO4 as depressant.
Acknowledgements
We thank Professor Lev Filippov from Université de Lorraine (France) and Barrie O’Connell (formerly at WAI, UK) who provided as mentors insight and expertise that assisted this research.
References
Baldwin, W. & Wittcoff, H. (1955). Fatty acids for chemical specialties. Symposium Proceedings, New York.
Bulatovic, S. (2015). Handbook of flotation reagents, chemistry, theory and practice, Volume 3.
Crozier, R.D. (1992). Flotation, Theory, Reagents and Ore Testing; Pergamon: Oxford, UK.
Filippova, I., Filippov, L., Duverger, A. & Severov, V. (2014). Synergetic effect of a mixture of anionic and nonionic reagents Ca mineral contrast separation by flotation at neutral pH. Minerals Engineering, pp. 135-144.
Ford, T. & Rieuwerts, J. (2000). Lead mining in the Peak District. Landmark: Ashbourne, p. 208.
Fuerstenau, D. & Bunge, R. (2006). The complex behavior of fatty acids in fluorite flotation. XXXIII Mineral Processing Congress Istanbul.
Gao, Z., Wang, C., Sun, W., Gao, Y. & Kowalczuk, P.B. (2021). Froth flotation of fluorite: A review. Advances in Colloid and Interface Science, Volume 290.
Greet, C.J., Kinal, J. & Mitchell, I. (2006). Is measuring pH enough? Perth, W.A.
Li, Y. (2015). The improvement effect of dispersant in fluorite flotation: Determination by the analysis of XRD and FESEM-EDX. Journal of spectroscopy, 5 pages.
Rao, K.H. & Forssberg, K.S.E. (1991). Mechanism of fatty acid adsorption in salt-type mineral flotation. Minerals Engineering Vol. 4, pp. 879–890.
Song, S., Lopez-Valdivieso, A., Martinez-Martinez, C. & Torres-Armenta, R. (2006). Improving fluorite flotation from ores by dispersion processing. Minerals Engineering, Volume 19, Issue 9, pp. 912-917, ISSN 0892-6875,
https://doi.org/10.1016/j.mineng.2005.10.005
Verwey, E.J.W. (1947). Theory of the stability of lyophobic colloids. The Journal of Physical Chemistry, 51(3), pp. 631-636.
Weiss, N. (1985). SME Mineral Processing Handbook V2. New York: Society of Mining Engineers.
Winter, G. & Woods, R. (1973). The relation of collector redox potential to flotation efficiency: Monothiocarbonates. Separation Science, 8(2), pp. 261-267.
doi:10.1080/00372367308058000
Zhang, Y. & Song, S. (2003). Beneficiation of fluorite by flotation in a new chemical scheme. Minerals Engineering, pp. 597-600.
Zhou, W. & Moreno, J. (2013). Flotation of fluorite from ores by using acidized water glass as depressant. Minerals Engineering 45, pp. 142-145.
1 Report on critical raw materials for the EU (European commission document, May 2014)
2 Communication from the Commission to The European Parliament, The Council, The European Economic and Social Committee and The Committee of the regions, Final Report, 2011
3 Communication from the Commission to The European Parliament, The Council, The European Economic and Social Committee and the Committee of the regions on the 2017 list of Critical Raw Materials for the EU 13.09.17